Zero-click search: how to measure SEO when nobody clicks
Roughly six in ten Google searches now end without a click, and AI Overviews cut clicks by up to 58% on the queries where they appear. Traffic is no longer a proxy for visibility — here is what to measure instead.
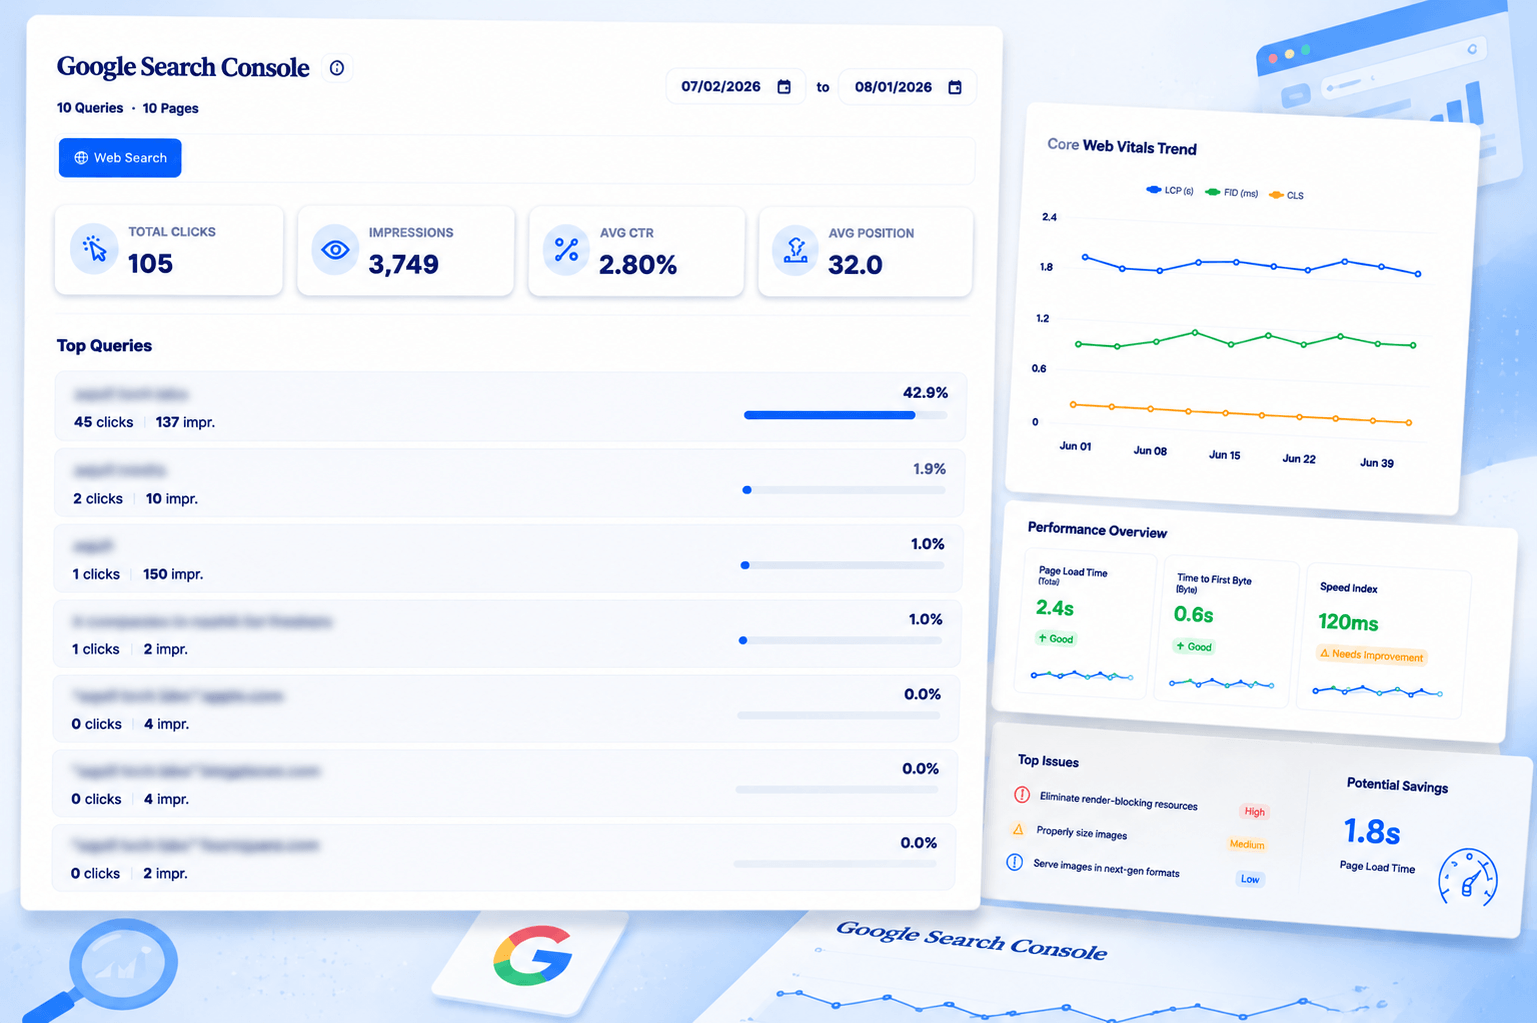
Your traffic chart is measuring the wrong thing
For twenty years, organic traffic was a reasonable stand-in for organic visibility. If more people saw you in search, more people clicked, and the line went up. That relationship has quietly broken.
Nearly 60% of Google searches now end without a click to any website. Position-one click-through rate for informational keywords has fallen from 7.6% to 3.9% since 2023 — the position did not change, the behaviour did. And on queries where an AI Overview appears, clicks drop by as much as 58%.
Read those together and an uncomfortable pattern emerges. You can hold every ranking you had last year, improve your technical health, publish more, and still watch sessions decline — because the answer is now being delivered on the results page or inside an assistant, and the click that used to follow it never happens.
Traffic is a downstream metric now, not a visibility metric. Visibility is whether your brand appeared and was attributed. Sometimes that produces a click. Increasingly it does not — and the absence of a click is not the absence of value.
Search has split into two systems
The most useful mental model right now is that there are two search systems running in parallel, and they agree far less than you would expect. Analyses of traditional results against AI-generated answers find an overlap of roughly 14% of URLs. Six sources out of seven cited in an AI answer are not the ones ranking on page one for the same query.
That single number explains a lot of confusion. It is why a brand can dominate its category in Google and be invisible in ChatGPT. It is why "we rank number one, so we must be fine" stopped being a safe conclusion. And it is why a rank tracker alone can no longer tell you whether your search strategy is working.
What each system rewards
| Traditional search | AI answers | |
|---|---|---|
| Unit of success | A ranked URL | A cited passage |
| What wins | Relevance, links, authority | Extractability, entity clarity, trust signals |
| Where you see it | Impressions and clicks in Search Console | Nowhere, unless you instrument it |
| Failure mode | You rank on page two | You are never named at all |
| Recovery speed | Weeks to months | Can shift within days |
The right response is not to abandon the first column. Traditional search still drives the majority of measurable revenue for most businesses. The response is to stop treating the second column as a rounding error, and to start collecting evidence about it.
Four things worth measuring instead
If traffic alone no longer answers "is our search strategy working", these four together do.
1. Appearance rate, per engine
For a fixed set of prompts that represent real buying questions in your category, how often is your brand named at all? Track it per engine, because visibility is rarely even — a brand strong in Perplexity is often absent from Gemini. A single blended percentage hides exactly the information you need.
2. Citation source mix
When an assistant answers a question about your category, which domains does it draw on? If third-party directories and review sites are cited ten times more often than your own pages, that is not a mysterious algorithmic preference. It is a content gap with a specific address.
3. Share of voice against named competitors
Appearance rate in isolation is hard to interpret — is 24% good? Against the same prompt set, how often is a competitor named instead of you? That comparison converts an abstract number into a decision.
4. Impression-weighted position, not average position
In Search Console, average position treats a query with four impressions the same as one with forty thousand. Weight by impressions and the number starts reflecting where you actually stand in front of demand.
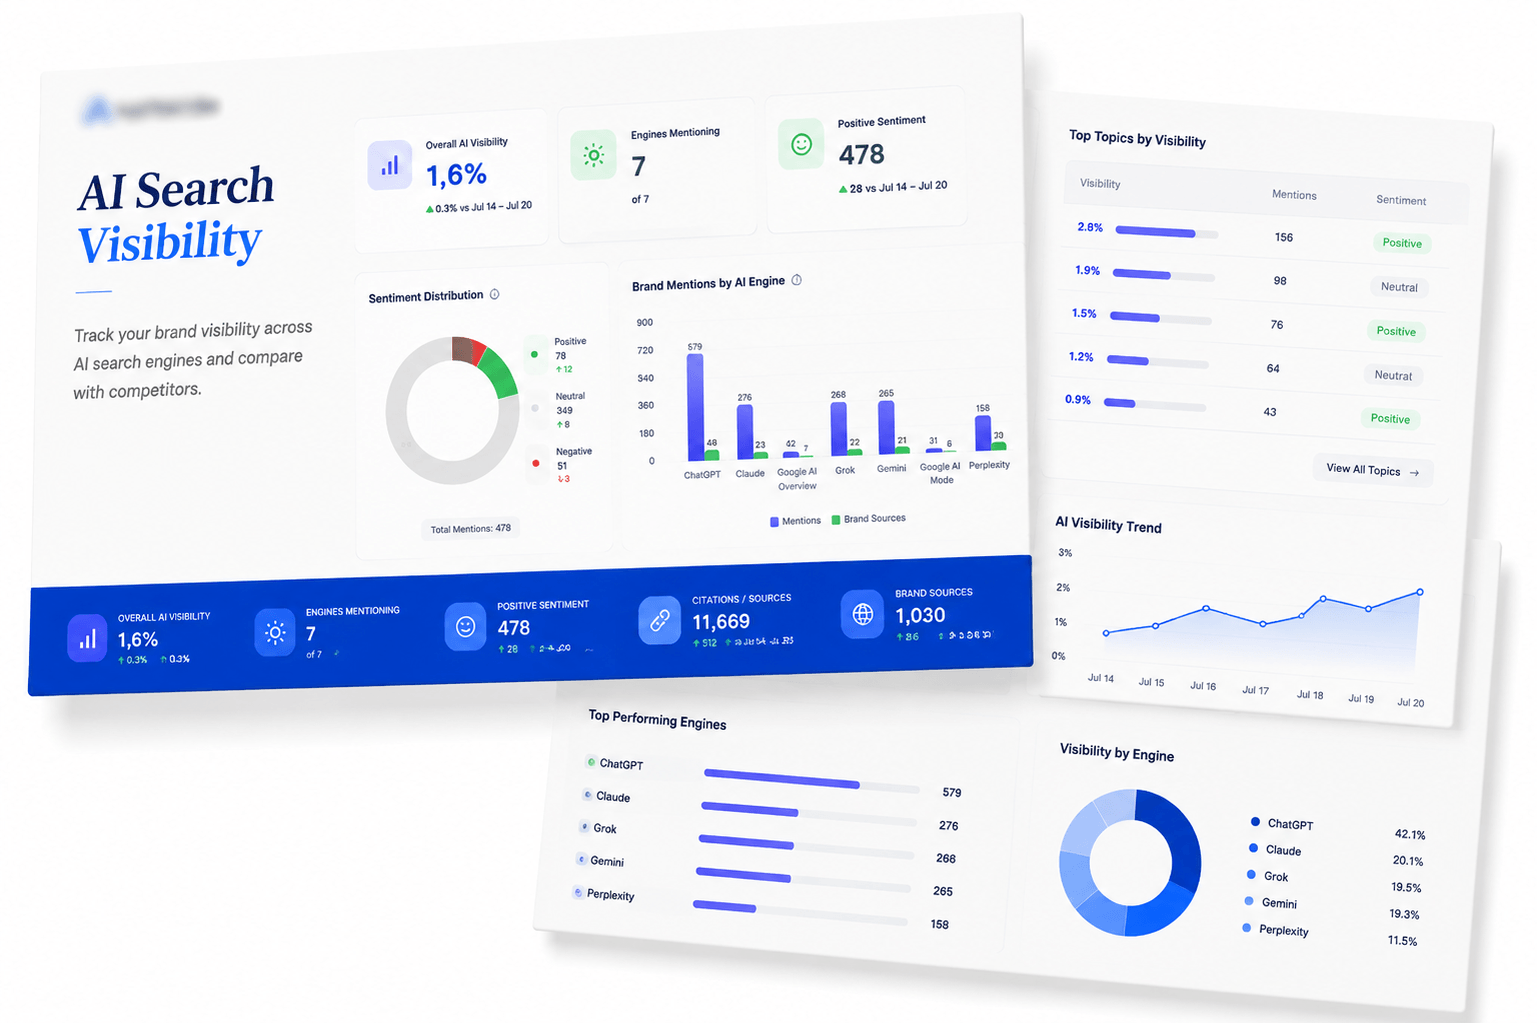
Do not average an AI appearance rate across runs and report the mean. The variance is real information — a prompt where you appear in three runs out of five is a genuinely different situation from one where you always appear, and both look identical once averaged.
Being cited is worth more than it looks
The natural objection to all of this is commercial: if there is no click, why care?
Because the click has not disappeared, it has moved. Brands cited inside an AI Overview earn 35% more organic clicks and 91% more paid clicks than uncited brands on the same query. Appearing in the answer functions as an endorsement that lifts every other surface you occupy on that page.
Trust has stopped being just a ranking factor and has become the primary filter for AI inclusion.Recurring finding across 2026 AEO research
There is a second-order effect that is harder to measure and probably larger. When an assistant names three vendors in a category and yours is one of them, you have been placed on a shortlist before the buyer has visited a single website. Whatever happens next in the funnel starts from a better position. That value shows up eventually as branded search volume and direct traffic — both of which you should be watching as leading indicators.
How to report this without losing the room
The practical difficulty is not analytical, it is political. If you have spent three years reporting sessions to a client or an executive, changing the metric mid-stream looks like moving the goalposts after a bad quarter.
Three things make that conversation go better.
- Introduce the new metrics before you need them. Add appearance rate and citation share to the monthly report while traffic is still healthy. It reads as thoroughness. Added during a decline, the same slide reads as an excuse.
- Keep traffic on the page. Do not replace it — contextualise it. A chart showing impressions rising while clicks flatten tells the zero-click story more convincingly than any explanation you could write.
- Report the gap, not the absolute. "We are named in 24% of category prompts; our nearest competitor is named in 9%" survives scrutiny in a way that a bare 24% does not.
Lead with impression-weighted position and appearance rate. Follow with share of voice against named competitors. Then traffic and conversions, framed as the outcome of the first two. Close with the citation source mix, because it is the section that produces the next month's content brief.
Where to start this week
You do not need a new stack to begin. You need a fixed prompt set and the discipline to check it on a schedule.
- Write down 20 questions a real buyer would ask an assistant in your category. Mix branded, comparison, and problem-first phrasings.
- Run them against at least three engines and record, for each: were you named, who else was named, and which sources were cited.
- Repeat weekly. The first run is a baseline and tells you almost nothing. The fourth tells you a great deal.
- Cross-reference the cited sources against your own site. Every third-party page cited in place of yours is a content brief that has written itself.
Do this manually for a month and you will understand your category's AI visibility better than most of your competitors understand theirs. Automate it after that, once you know which prompts actually matter.
Appearance rate per engine, citation sources, AEO scoring and competitor share of voice are tracked daily across seven AI engines. See how it works →
Sources
Keep reading
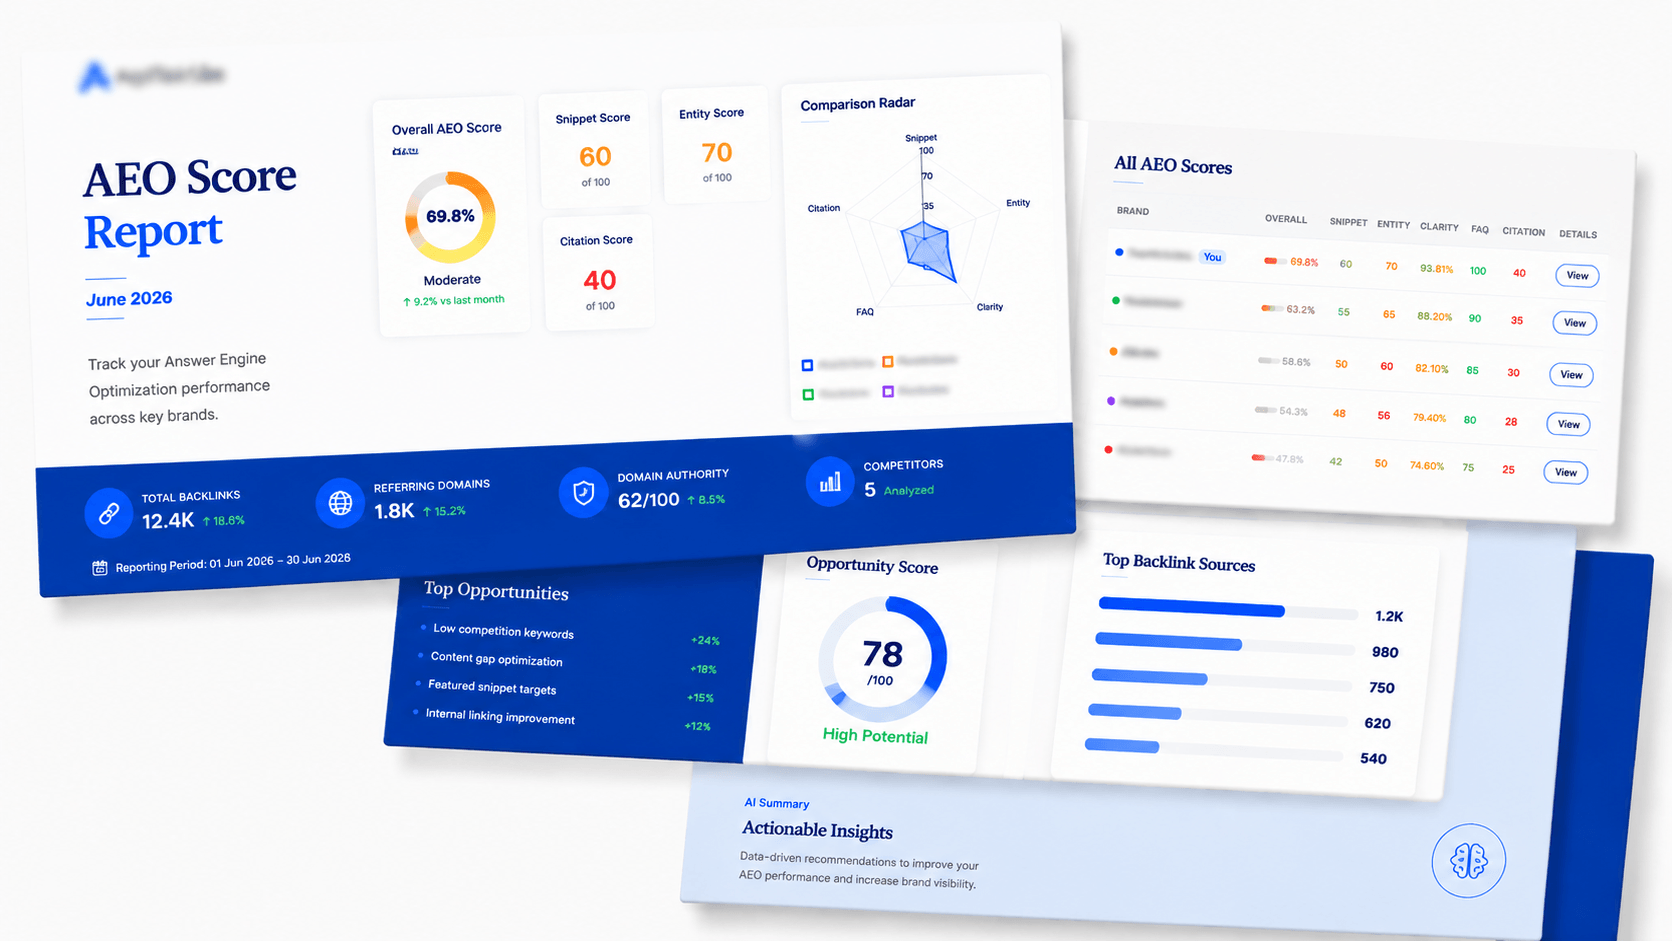
AEO, GEO, LLMO: which acronym actually needs a budget
Four new optimisation disciplines appeared in eighteen months, and most of the writing about them is definitional rather than useful. Here is what each one genuinely means, where they overlap, and which of them changes what you do on Monday.
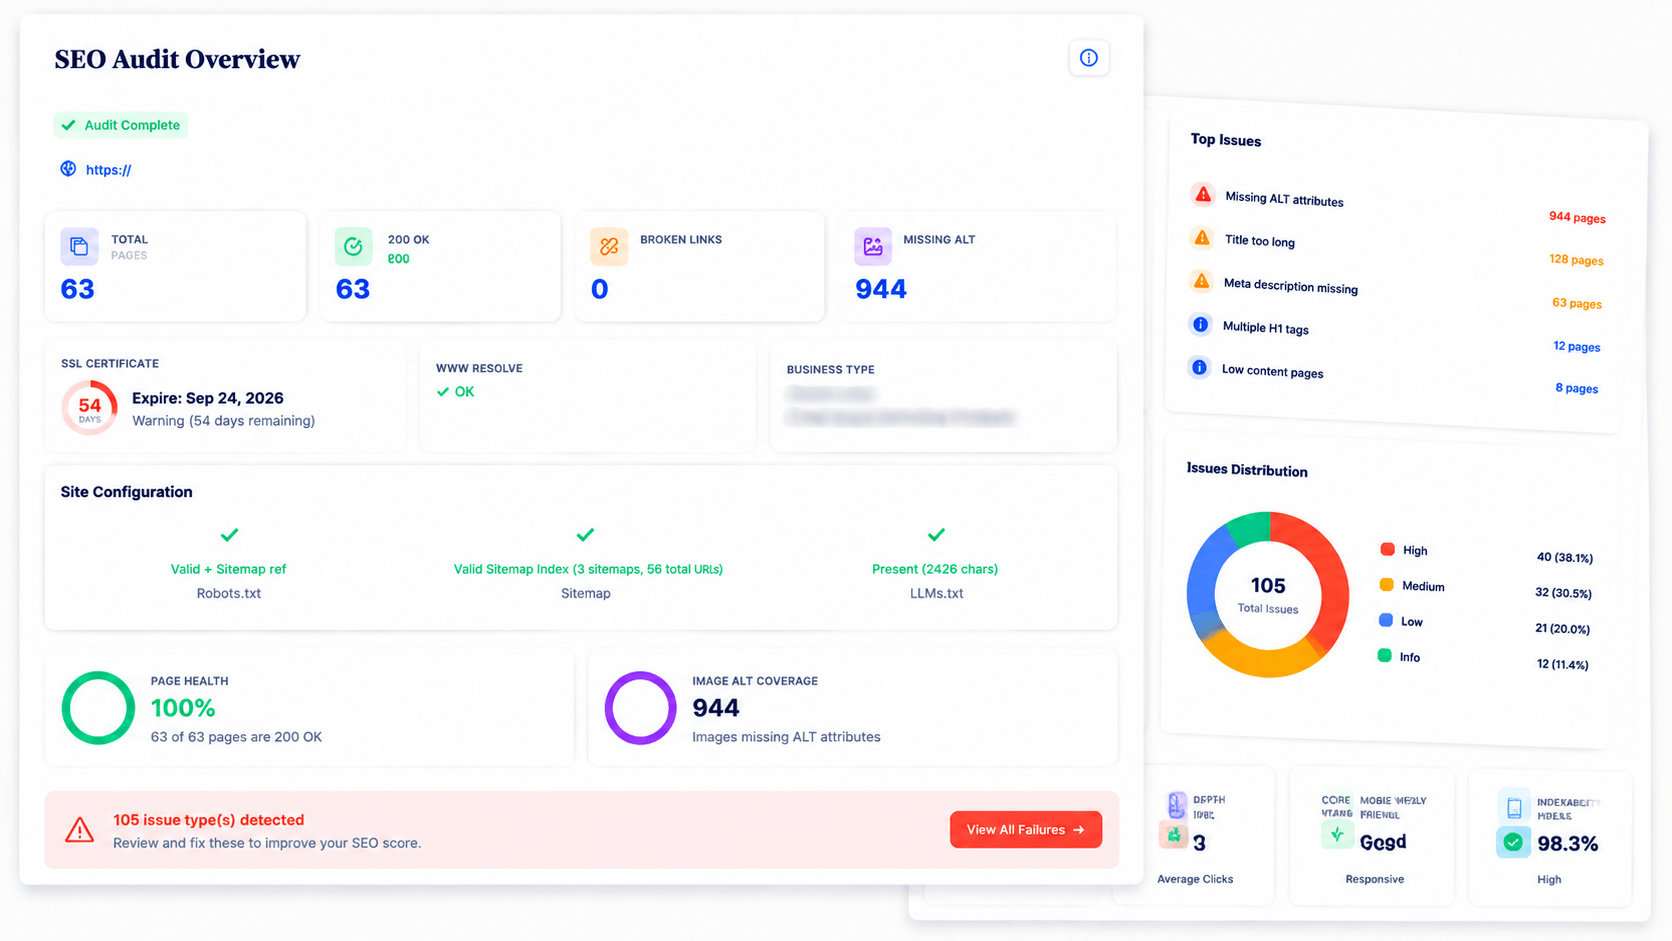
llms.txt: the honest answer on whether it does anything
Adoption has reached roughly one site in ten. AI crawlers request the file in about 0.1% of visits. Google has said on the record that it does not support it. Here is what the evidence actually shows — and the narrow case where adding one still makes sense.
Stop guessing at AI visibility
Track appearance rate, citations and competitor share of voice across seven AI engines — alongside your rankings and technical health.